


THE FLYING LIZARD
Aviation-Driven Drone Intelligence
KFNL AIRPORT
NORTHERN COLORADO REGIONAL AIRPORT
Northern Colorado Regional Airport — Loveland, CO
Mapping a Runway Is Easy. Proving the Map Is Another Matter.
A 1.5-mile runway corridor. Thousands of images. Independent control. One question: how well can a large aerial dataset hold together from one end to the other?
Airports are unusually demanding places to map.
They may appear relatively simple from above—long stretches of pavement, open terrain and clearly defined infrastructure—but their scale creates a different challenge. A small error that may be difficult to notice across a compact site can become much more significant when the project stretches thousands of feet from one end to the other.
At Northern Colorado Regional Airport (KFNL), THE FLYING LIZARD set out to examine that challenge directly. The mission covered the airport’s primary runway corridor using high-overlap Smart Oblique imagery, ground control and an independently evaluated checkpoint. The objective was not simply to produce an attractive aerial map. It was to understand how the dataset performed across the length of a large, linear site—and to document both what worked and what the results could teach us.
THE MISSION
Northern Colorado Regional Airport is jointly owned and operated by the Cities of Fort Collins and Loveland and serves both general aviation and commercial operations in Northern Colorado.
Its primary runway extends 8,500 feet—more than a mile and a half from end to end.
For this mission, THE FLYING LIZARD used a DJI Matrice 4E to capture approximately 206 acres surrounding the runway corridor.
Rather than using a conventional nadir-only grid, the aircraft flew a Smart Oblique mapping mission. During flight, the camera captured both downward-looking and angled imagery, creating a much richer set of overlapping viewpoints across the site.
That additional geometry matters even on terrain that appears relatively flat.
Large sites contain pavement edges, drainage features, buildings, signs, vegetation, elevation changes and other features that benefit from being observed from multiple perspectives. The result is a dataset designed not only for a high-resolution orthomosaic, but also for detailed three-dimensional reconstruction.
By the end of the mission, more than 4,800 images had been captured across the runway environment.
CONTROL ACROSS A LONG CORRIDOR
Capturing thousands of images is only the beginning.
To evaluate how well the reconstructed site corresponded with known positions on the ground, five AeroPoints were distributed along the runway corridor. Four were used as Ground Control Points (GCPs)—known positions introduced into the photogrammetric reconstruction to help constrain the model. The remaining point was deliberately withheld from that process.
It became an independent checkpoint.
That distinction matters.
A Ground Control Point helps build the solution. A checkpoint does not. Its coordinates can therefore be compared against the completed model to provide an independent indication of how accurately the reconstructed surface represents a location that was never used to correct it.
For a compact site, control can often be distributed relatively close together.
FNL was different.
The runway corridor stretched approximately 1.5 miles, making control placement, image geometry and distance from control much more consequential. That was precisely what made the mission valuable.
THE MAP WASN'T THE FINAL DELIVERABLE
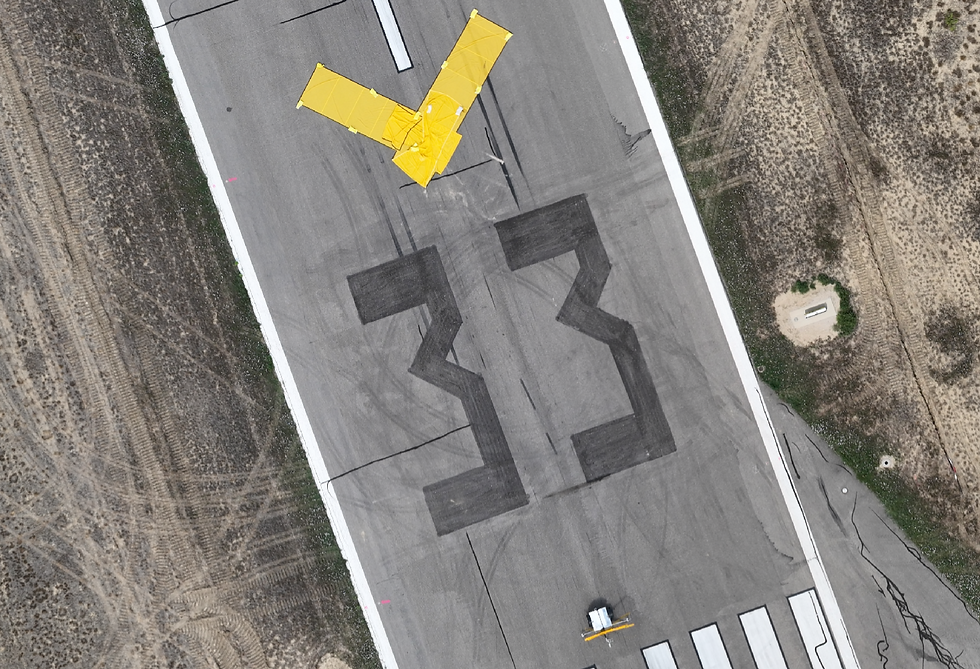
The imagery was processed into a high-resolution orthomosaic, creating one continuous overhead representation of the runway and surrounding environment.
But producing the map was not the end of the work.
The dataset was reviewed, ground control was marked throughout the imagery, the project was reoptimized and the independent checkpoint was evaluated against the completed reconstruction. The checkpoint produced a horizontal difference of approximately 3.2 inches from its independently measured position.
Its vertical difference was approximately 10.5 inches.
Those two numbers tell different parts of the story.
Horizontally, the model remained remarkably close to the independent position across a very large corridor.
Vertically, the result showed that the control configuration could be improved.
And that is useful information.
Because validation isn't about finding a number that looks impressive.
It is about discovering how the mapping system actually performed.
WHY THAT MATTERS
An attractive orthomosaic can look correct while still telling you very little about its positional accuracy.
Everything may line up visually. Pavement edges can appear sharp. Buildings can look straight. Runway markings can be perfectly recognizable.
None of those things independently prove where those features are located in the real world.
Ground control and checkpoints provide another layer of information. They allow the finished dataset to be compared against independently established positions rather than evaluated only by appearance.
At KFNL, that comparison also exposed something important about long-corridor mapping: control should not merely exist within a project. It needs to be positioned intelligently throughout it.
The mission therefore became more than a successful mapping exercise. It became a controlled field study that directly informed how THE FLYING LIZARD will approach similar large-area and corridor projects in the future.
FROM TWO DIMENSIONS TO THREE
The Smart Oblique imagery also supported a detailed three-dimensional reconstruction of the runway environment.
That changes how the airport can be examined.
An orthomosaic provides a powerful overhead reference, but a three-dimensional model allows the same site to be viewed from virtually any direction. Runway geometry, taxiways, surrounding buildings, terrain and other features can be examined in relationship to one another rather than only from directly above.
Perspectives can be created after the flight for discussions, documentation or presentations without returning the aircraft to the air.
The result is not simply a collection of aerial photographs. It is a digital representation of the airport environment captured at a specific moment in time.
WHAT THE DATA TAUGHT US
One of the most valuable outcomes of a technical mission is sometimes discovering what should be done differently next time.
The KFNL dataset demonstrated that the DJI Matrice 4E and Smart Oblique acquisition could successfully capture and reconstruct a runway corridor of this scale. It also demonstrated the importance of control geometry.
For future corridor missions of similar length, THE FLYING LIZARD would use additional Ground Control Points and independent checkpoints distributed more deliberately throughout the project, including the ends, center and transitional areas of the flight.
A lower flight altitude may also be selected when the mission requires more precise identification and marking of ground targets within individual images.
Those aren't corrections hidden after the project.
They're lessons produced by the project.
That is part of the reason we conduct controlled missions like this.
Every dataset should improve the next one.
THE BOTTOM LINE
Aerial mapping isn't finished when the aircraft lands.
And it isn't finished when the orthomosaic appears on the screen.
The real value comes from understanding what the dataset represents, how it was built, how it was validated and where its limitations lie.
At Northern Colorado Regional Airport, more than 4,800 aerial images became a connected two- and three-dimensional representation of an 8,500-foot runway corridor.
Ground control helped establish the model.
An independent checkpoint challenged it.
And the results gave us something more useful than a beautiful map.
They gave us evidence.
That is the difference between simply seeing a site from above and understanding what the data can actually tell you.
Mission Data Snapshot
Date of Flight: August 2026
Location: Loveland, Colorado
Site: Northern Colorado Regional Airport (FNL)
Platform: DJI Matrice 4E
Mission Type: Smart Oblique Aerial Mapping
Area Captured: Approximately 206 acres
Primary Runway Length: 8,500 feet
Flight Altitude: 300 feet Above Ground Level (AGL)
Ground Sampling Distance (GSD): Approximately 1.20 inches per pixel
Images Captured: 4,804
Ground Control: 4 Ground Control Points (GCPs)
Independent Validation: 1 Checkpoint
Checkpoint Horizontal Difference: 0.266 ft / 3.19 in
Checkpoint Vertical Difference: 0.874 ft / 10.49 in
Primary Deliverables: High-resolution orthomosaic, aerial mapping dataset and interactive three-dimensional site model
Technical Insight: A five-point control study across a 1.5-mile runway corridor demonstrated strong horizontal performance while showing how control distribution and flight altitude can influence vertical validation across long, linear mapping projects.
Northern Regional Colorado Airport
Explore Northern Colorado Regional Airport in 3D
This interactive photogrammetric model provides a three-dimensional view of the Northern Colorado Regional Airport runway corridor, including the runway, taxiways, airport facilities, surrounding terrain, and adjacent areas. Unlike a fixed aerial image, the model allows you to examine the airport environment from different elevations and perspectives.
Click and drag to rotate the model. Scroll to zoom, and use the full-screen control for a larger view.
For a larger, higher-resolution viewing experience, [open the model directly on Sketchfab].
[click above image] to enlarge
Explore the KFNL dataset below. Select any image for a closer view.


